An important part of any modern development group is Dev-Ops and adding metrics and telemetry to your applications and infrastructure. Adding metrics will (to name a few):
- Allow a development group and company to understand the ebb and flow of their applications and infrastructure.
- Allow alerts to be defined and sent when a server or service goes down or gets stressed.
- Allows a company to identify when more servers are required or others require retiring.
- Identify the correct scaling requirements for your application.
This blog post is a quick short note of what we did here at Riomhaire Research to produce a couple of our devops dashboards:
Infrastructure Needed
Lets start of by stating there are many different ways of achieving what we did from the custom roll-your-own variety to big commercial ones. After some research and having discussion two common technologies seem to be Promethus for gathering and storing the data and Grafina to create the dashboards.
Having decided the technologies we make it simpler to install by using a readily available docker-compose container stack. The one we choose was Vegabrianc which was fairly straight forward to set up and use.
The next step was to install on our infrastructure an application to gather the machine level statistics like memory and cpu usage. This we chose to do ourselves and install it as a service on our servers. This service has been released as open source and can be found at our github repository.
The final step was to modify our applications to expose a ‘/metrics’ endpoint which for clients which request an ‘Accept’ header of the type ’text/plain’ returns prometheus compliant counters, guages etc. An example of this would look like:
# HELP systeminfo_memory_bytes How much memory.
# TYPE systeminfo_memory_bytes gauge
systeminfo_memory_bytes 8251195392

# HELP systeminfo_memory_available_bytes How much memory available.
# TYPE systeminfo_memory_available_bytes gauge
systeminfo_memory_available_bytes 974381056

# HELP systeminfo_memory_used_bytes How much memory available.
# TYPE systeminfo_memory_used_bytes gauge
systeminfo_memory_used_bytes 7276814336

# HELP systeminfo_memory_used_percentage How much memory used as percentage.
# TYPE systeminfo_memory_used_percentage gauge
systeminfo_memory_used_percentage 88.19103160561781


# HELP systeminfo_host_uptime How long been on
# TYPE systeminfo_host_uptime counter
systeminfo_host_uptime 764990

# HELP systeminfo_host_procs How Many Processes
# TYPE systeminfo_host_procs guage
systeminfo_procs 547


# HELP systeminfo_load_1 Load Last Minute
# TYPE systeminfo_load_1 guage
systeminfo_load_1 2.54

# HELP systeminfo_load_5 Load Last 5 Minute
# TYPE systeminfo_load_5 guage
systeminfo_load_5 2.59

# HELP systeminfo_load_15 Load Last 15 Minute
# TYPE systeminfo_load_15 guage
systeminfo_load_15 2.62


# HELP systeminfo_cpu_cores Number or Cores
# TYPE systeminfo_cpu_cores counter
systeminfo_cpu_cores 8

# HELP systeminfo_cpu_load load
# TYPE systeminfo_cpu_load guage
systeminfo_cpu_load 31.08458744078956


# HELP systeminfo_network_bytes_sent Network bytes sent
# TYPE systeminfo_network_bytes_sent counter
systeminfo_network_bytes_sent 8172723733

# HELP systeminfo_network_bytes_received Network bytes received
# TYPE systeminfo_network_bytes_received counter
systeminfo_network_bytes_received 18927111005

# HELP systeminfo_network_packets_sent Network packets sent
# TYPE systeminfo_network_packets_sent counter
systeminfo_network_packets_sent 14048251

# HELP systeminfo_network_packets_received Network packets received
# TYPE systeminfo_network_packets_received counter
systeminfo_network_packets_received 21114441
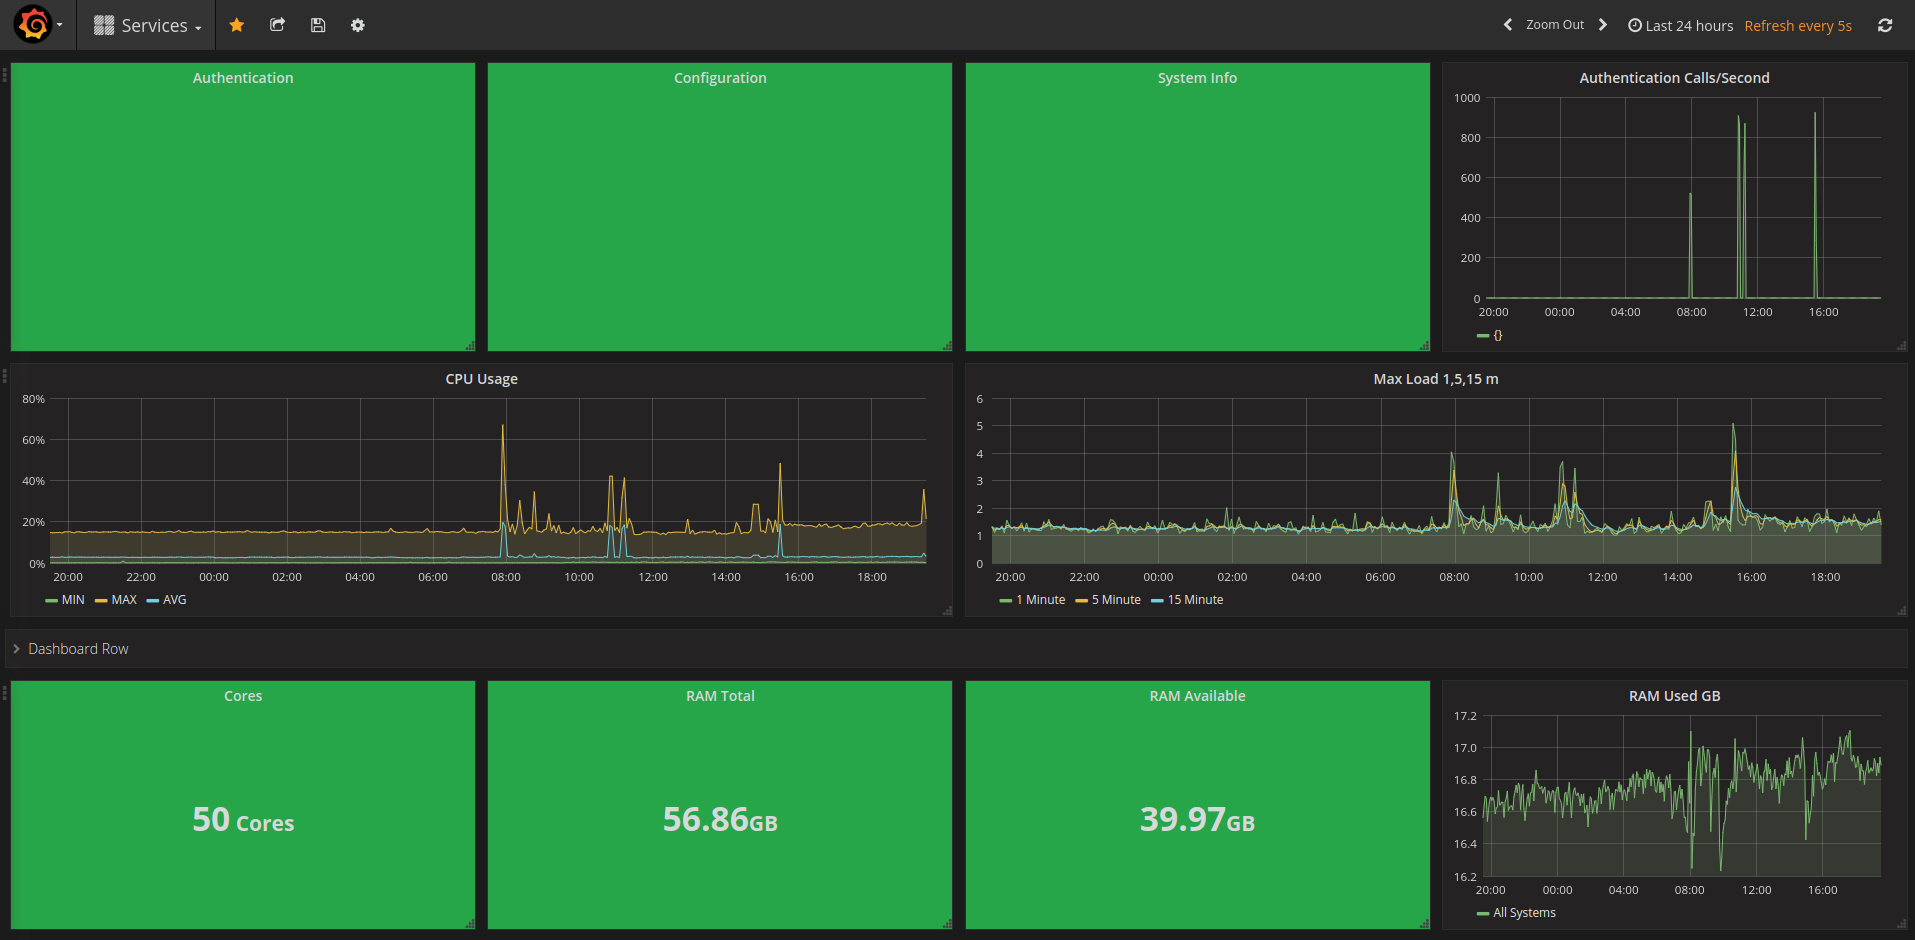
Putting it all together and learning a bit about grafana and prometheus allowed to create a Hardware and Application Dashboard.
Hardware Dashboard

Application Dashboard